Ever wonder what makes some drivers stand out? That million-dollar edge is all about telemetry explained. It’s all about using data to gain an edge.
Imagine watching an endurance race. The commentators are amazed by the pro teams’ skills. They’re really talking about the live data stream that acts as the car’s digital heartbeat. It’s like having digital detectives solve problems before they happen.
In sim environments, it’s the same idea. Every move you make is recorded for later analysis. Formula 1 takes it to the next level with over 300 sensors sending data back to the team.
This isn’t just numbers on a screen. It’s the secret language of speed. That’s telemetry explained. It’s the nervous system of modern performance analysis.
Types of Signals Used
Racing telemetry signals are like the car’s nervous system. Each data point tells a story your eyes alone can’t see. They’re not just numbers; they’re the car’s honest feedback on your driving.
RPM is like the engine’s heartbeat monitor, telling you to shift. Vehicle speed shows if you’re truly fast or just loud. Throttle position reveals your driving style – smooth or wild.
G-forces show who’s an artist and who’s not. Lateral G tells you about cornering, while longitudinal G shows your braking and acceleration. It’s physics showing you your true ambition.
Then there are the car’s vital signs. Oil pressure and temperature are like a report card for the engine. Water temperature warns of engine overheating. These signals help avoid expensive repairs.
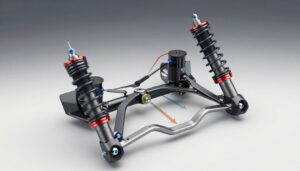
Modern racing telemetry goes beyond basic signs. Steering angle data shows the car’s response to your input. Suspension load measurements reveal balance issues early. Tire temperature gradients show real grip versus theory.
Lap times and sector splits are the ultimate check. They show where you’re losing time – in braking, corner entry, or hesitation.
| Real-World Racing Signals | Sim Racing Equivalents | What They Reveal |
|---|---|---|
| Oil/Water Temperature | CPU/GPU Load Metrics | System stress levels |
| Tire Wear Patterns | Tire Model Behavior | Setup optimization |
| Fuel Consumption | Virtual Fuel Calculations | Strategy planning |
| Suspension Load Data | Force Feedback Signals | Vehicle balance |
Racing telemetry is universal. It applies to both real racing and sim racing. These signals turn feelings into facts, making your driving better.
This isn’t just data collection; it’s like car therapy. The car always tells the truth. The question is, are you listening?
Hardware & Software
Remember when motorsport data was only for the rich? Now, it’s like finding a Lamborghini at a low price. This change is huge.
Let’s talk about the hardware. These small sensors turn car sounds into digital data. We’re looking at:
- RPM pickups that read engine sounds like a doctor
- G-force sensors that measure turns with dancer precision
- Temperature probes that know your brakes better than your coffee
Now, even beginners can get top-notch insights. What cost a lot five years ago now fits in your pocket.
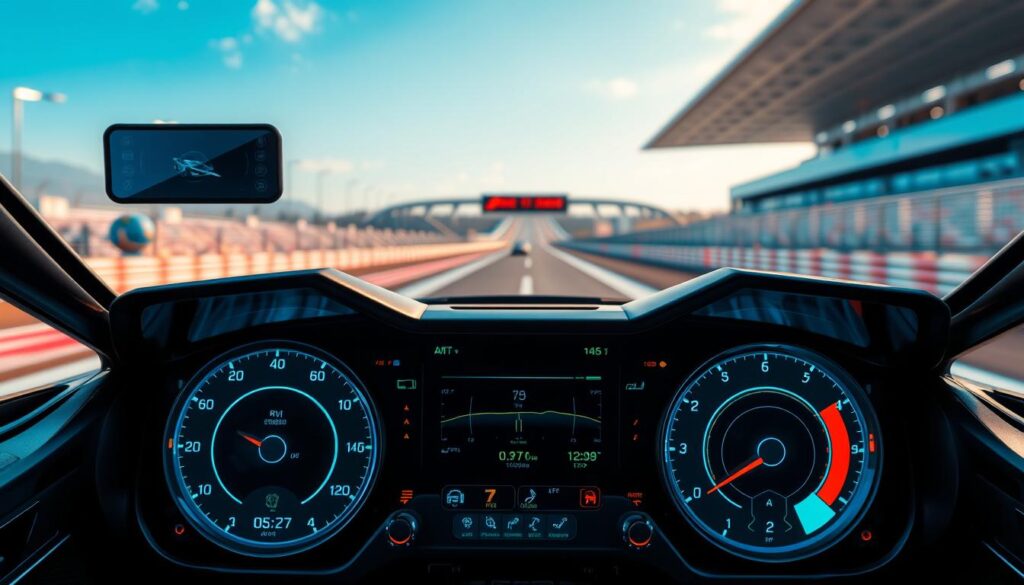
The software side is where numbers turn into racing tips. MoTeC i2 is the top choice, like Photoshop for cars. Virtual Racing School (VRS) lets you compare with pro drivers’ data.
Want to see your car’s stats live? SimHub shows you everything in real-time. It’s like NASA’s dashboard. These tools are the latest in sim racing telemetry how to use it right.
Formula 1 uses over 300 sensors per car, sending 3GB of data per race. But now, fans can see the same data as the engineers. It’s like getting the director’s cut of a movie.
The data analysis revolution lets every serious racer be an engineer. Affordable sensors and smart software find tiny improvements. That tenth-of-a-second you’ve been chasing? It’s in the data.
Real-time systems have changed how we watch racing. What needed a data science degree now is easy to use. The entry barrier is gone, and the insights are deeper.
This isn’t just new tech – it’s a whole new way to see motorsport data. The digital gold rush is here, and the tools are affordable.
Key Data Points (Brakes, Throttle, G-Force)
Welcome to the holy trinity of racing telemetry – where your driving personality is revealed quickly. These three data points don’t just measure performance; they show who you really are behind the wheel.
Let’s start with braking. Longitudinal G-force tells the truth about your stopping consistency. I’ve seen drivers who think they’re braking hard, but the data shows they’re easing off during downshifts. The difference between a pro and an amateur? About 10 meters and 0.150 seconds per corner.
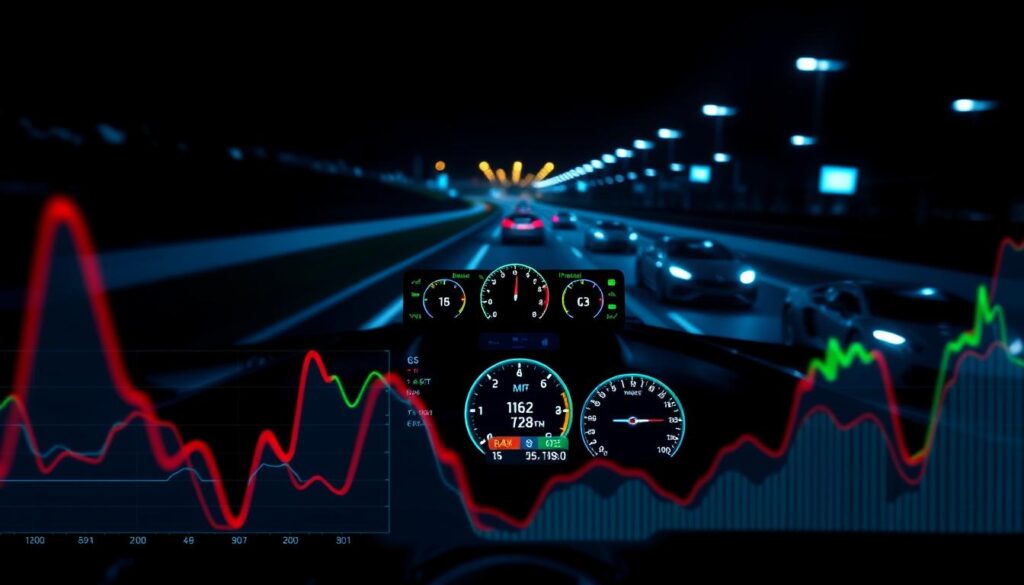
Throttle application is where art meets analytics. By comparing throttle position against speed, we see who’s conducting a symphony and who’s playing whack-a-mole. Drivers can gain 4 mph on corner exit by being more progressive – it’s like the difference between fine wine and a bucket.
Now for the physics lesson: G-forces. Lateral G shows your cornering commitment, while Total G combines lateral and longitudinal. It’s like balancing a champagne glass on a Ferrari’s hood at full tilt.
The data exposes everything: throttle hesitation that costs half a second by straight’s end, braking inconsistencies that add up to podium margins. This isn’t just number-crunching – it’s behavioral analysis with consequences measured in trophies and heartbreaks.
Modern racing telemetry turns these three metrics into your personal driving fingerprint. They reveal whether you’re a surgeon or a butcher, an artist or a bull in a china shop. The best part? The data never lies, even when your ego does.
Case Study: Telemetry in Action
Remember Hungary 2023? Mercedes didn’t guess their strategy – they computed it. Hamilton’s late three-stop gamble wasn’t just a guess. It was telemetry whispering two extra positions into their headsets at 200 mph. This is what makes champions stand out.
You don’t need an F1 budget to benefit. I’ve seen sim racers shave seconds by using their data. One driver lost half a second in a single corner because they felt fast. But the numbers showed they were actually slower.
This is where continuous data stream becomes racing’s ultimate truth-teller. Comparing two pro drivers’ telemetry showed a trade-off. One had more entry speed but got to full throttle 100 feet later. This cost 1.5 tenths down the entire straight. The best approach? A mix of both.
Telemetry turns racing from art to science, yet makes it more artistic. It’s the objective reality check in a sport filled with subjective feelings. Whether analyzing your own laps or F1 strategies, proper telemetry explained is more than data. It’s enlightenment.